Measurement
Part of Measure productivity software with a metric contract and a baseline you can revisit
Four ways to tell whether productivity software actually changed anything
Compare four ways to assess whether productivity software contributed to change, using consistent criteria for evidence strength, data, assumptions and cost.
Business productivity software attribution methods differ in the question they can answer. A simple before-and-after view records change. A credible causal claim needs a defensible account of what would have happened without the software.
This comparison is for an England-based organisation planning an evaluation. It uses four consistent criteria: evidence question, data needed, main assumption and practical burden. No method guarantees a valid result. A qualified analyst should design the study, with privacy, employment and financial review where relevant.
What to take away
- Before-and-after views show change but cannot prove the software caused it.
- Causal claims need a defensible counterfactual and comparable data for intervention and comparison groups.
- Interrupted time series can detect level or trend changes but remains vulnerable to concurrent events.
- Phased rollout and randomised designs require careful planning to avoid selection and spill-over problems.
- Match the strength of your claim to the decision at stake and the design you can support.
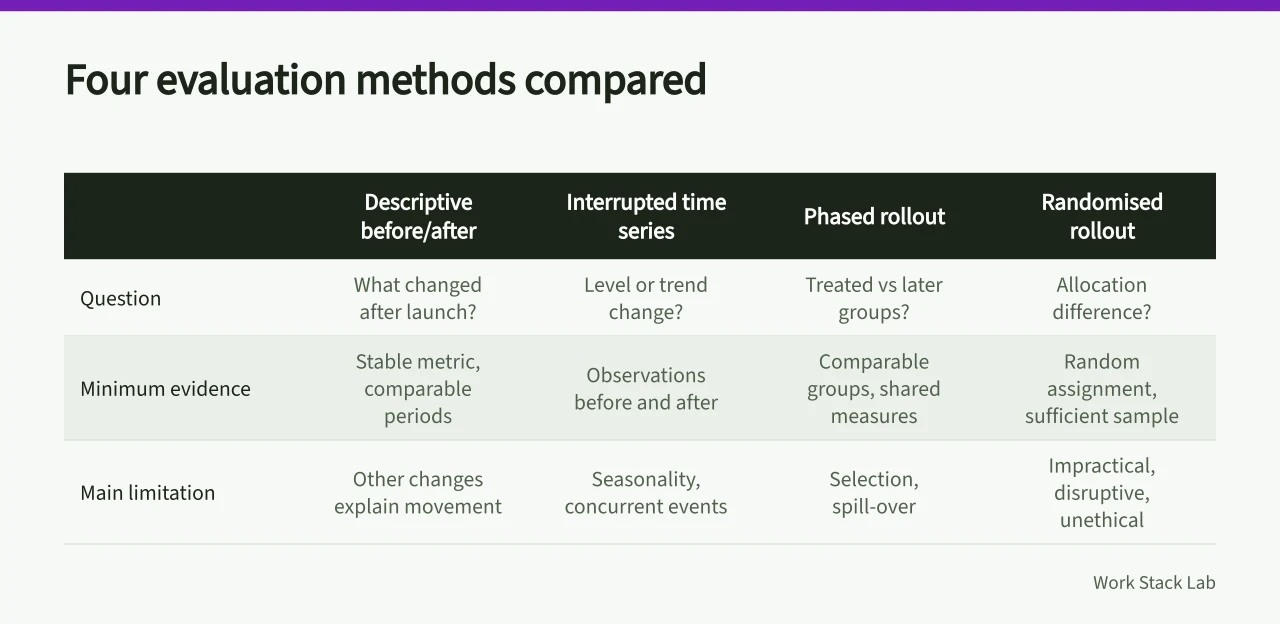
Four methods compared
Question it can address
- Descriptive before and after
- What changed after launch?
- Interrupted time series
- Did the level or trend change at launch?
- Phased rollout comparison
- Did treated groups change differently from later groups?
- Randomised rollout
- What average difference did allocation produce?
Minimum evidence
- Descriptive before and after
- Stable metric definition and comparable periods
- Interrupted time series
- Enough observations before and after, with intervention timing
- Phased rollout comparison
- Comparable groups, shared measures and controlled rollout dates
- Randomised rollout
- Eligible units, random assignment, pre-set outcomes and sufficient sample
Main limitation
- Descriptive before and after
- Other changes can explain the movement
- Interrupted time series
- Seasonality and concurrent events can distort the estimate
- Phased rollout comparison
- Selection and spill-over can break the comparison
- Randomised rollout
- May be impractical, disruptive or ethically unsuitable
HM Treasury's Magenta Book explains that experimental and quasi-experimental approaches use a counterfactual and require comparable data for intervention and comparison groups. Its audience is central government. The design logic transfers, but the scale and assurance should match the business decision.
Descriptive before and after
Freeze the workflow, measure and periods before reading the result. Show demand, work mix and known operational changes beside it. Use language such as "cycle time was lower in the later period", not "the platform saved time".
Descriptive before and after
Before launch
- Cycle time
- Higher
- Demand
- Recorded
- Work mix
- Documented
- Operational changes
- Noted
After launch
- Cycle time
- Lower
- Demand
- Recorded
- Work mix
- Documented
- Operational changes
- Noted
This is suitable for service monitoring and hypothesis generation. It becomes especially weak when the launch coincides with staffing, policy, seasonal or customer changes. A short baseline can mistake ordinary variation for improvement.
Interrupted time series
Plot a consistent outcome across multiple time points on both sides of a clear intervention date. Model a change in level, trend or both, chosen in advance. Document seasonality, autocorrelation and events that could alter the series.
Interrupted time series
- BeforeMultiple observations
- InterventionLaunch date
- AfterMultiple observations
- ModelLevel, trend or both
The Magenta Book's analytical-method annex warns that series length, slow trends and external influences matter. The method can be stronger than a two-period snapshot, but it is not immune to another event occurring at launch.
Phased rollout comparison
Use the same outcome, unit, extraction rule and dates for groups that adopt now and later. Compare pre-launch trends before treating the later group as a counterfactual. Record why each group entered its phase.
This design can fit a planned operational rollout, but manager choice may put the most capable or troubled team first. Work shared across groups can also contaminate the contrast. Adjusting for observed differences cannot guarantee that hidden differences disappeared.
Randomised rollout
Random assignment can balance known and unknown influences on average when carried out properly. Pre-register the eligible population, allocation, primary outcome, analysis and stopping rule. Keep the service available where withholding it would cause unacceptable harm.
Randomisation does not repair a vague metric, low adherence or underpowered sample. It estimates an effect for the studied population and conditions, not every team or future product version.
Choose claim strength before cost
If the decision only needs operational learning, careful descriptive monitoring may be proportionate. A large renewal, workforce change or public claim of savings deserves stronger design and independent review. The 2026 Green Book separates monitoring from evaluation and asks public bodies to plan evaluation early; it is not a private-company mandate.
Write the intended sentence before selecting the method. If the available design cannot support that sentence, weaken the claim or improve the study. Never upgrade association to causation in the final report.
Before you act
- Write the intended sentence before selecting a method.
- Freeze the workflow, measure and periods before reading results.
- Document seasonality, autocorrelation and concurrent events.
- Pre-register the eligible population, allocation and primary outcome.
- Weaken the claim if the design cannot support it.
- Never upgrade association to causation in the final report.
Common questions
What is the main limitation of a descriptive before-and-after comparison?
Other changes can explain the movement. The method records what changed after launch but cannot rule out staffing, policy, seasonal or customer changes that coincide with the launch. It is suitable for service monitoring and hypothesis generation, not for making causal claims about the software's effect.
How does an interrupted time series improve on a simple before-and-after view?
It uses multiple observations before and after a clear intervention date to model changes in level or trend. This can be stronger than a two-period snapshot, but it is not immune to another event occurring at launch. Seasonality and concurrent events can still distort the estimate.
When might a randomised rollout be unsuitable?
It may be impractical, disruptive or ethically unsuitable. Randomisation does not repair a vague metric, low adherence or underpowered sample. It estimates an effect for the studied population and conditions, not every team or future product version. Withholding the service where it would cause unacceptable harm is not acceptable.