Measurement
Measure productivity software with a metric contract and a baseline you can revisit
Measure productivity software with defined flow, quality and outcome indicators, honest attribution, reproducible reporting and comparable evidence.
Good business productivity software measurement starts with a decision, not a dashboard. Decide what the organisation needs to learn, define each indicator before looking at the result, and preserve enough context to explain a change. Usage alone cannot show that work improved.
This guide is for organisations in England. It draws on UK government and regulator material but does not transfer public-sector reporting duties to private businesses. It offers no universal benchmark and makes no claim that software caused an outcome. An analyst should review the method; privacy, employment, finance and commercial specialists should check measures that affect their fields.
What to take away
- Decide what the organisation needs to learn before choosing any indicator or dashboard.
- A baseline must use the same unit, period and inclusion rules as the later result.
- Write a metric contract covering definition, data source, owner, exclusions and limitations.
- Combine demand, flow, quality and outcome measures so one number cannot mislead.
- Store calculation logic under version control so a second analyst can recreate the number.
Write the question before the metric
Begin with the operating decision. "Should we add licences?" needs evidence about eligible users, unmet demand and constraints. "Is the workflow healthier?" calls for flow, ageing, quality and user evidence. "Did the purchase produce a return?" needs a baseline, full costs and a credible account of what would otherwise have happened.
From change to outcome
- Organisation changes process and configures tool
- People use new route under stated conditions
- Waiting or rework mechanism changes
- User or business outcome may follow
Government Digital Service guidance on setting performance metrics starts with service purpose and hypotheses, then asks teams to choose measures and data sources. Its mandatory indicators apply to government services in scope. The useful lesson for a private operator is the order: purpose, question, definition, data and interpretation.
Turn the intended change into a short chain:
- The organisation changes a process and configures a tool.
- People use the new route under stated conditions.
- Waiting, rework or another operational mechanism changes.
- A user or business outcome may follow.
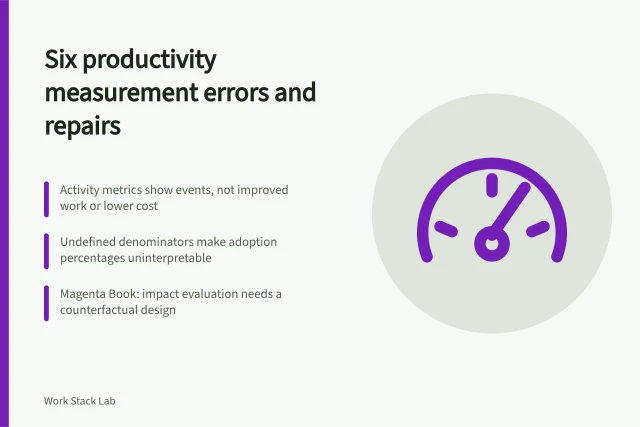
Measure more than one link. If adoption rises but rework does not fall, the evidence does not support the full story. It may show that people logged in, nothing more.
Record a baseline that can be revisited
Choose a pre-change period long enough to reveal ordinary variation, deadlines and seasonality. Keep its start and end dates, inclusion rules, workflow version and known disruptions. If the old process lacks reliable timestamps, say so. Reconstructed estimates should not be presented as observations.
The baseline needs the same unit as the later result. A weekly completion count cannot be compared directly with a monthly total, and a team-wide average may shift because the mix of easy and difficult work changed. Preserve the underlying eligible population and work categories where lawful and proportionate.
Do not quietly discard an inconvenient early period or outage. Annotate it, show the result with and without it when justified, and explain the choice.
Government Analysis Function guidance on communicating quality, uncertainty and change asks producers to explain definitions, data sources, adjustments and uncertainty so readers can judge fitness for use. It targets official statistics; its transparency discipline suits internal management information.
Build a metric contract
Every measure needs a written contract. At minimum, specify:
- the question it answers and the decision it informs;
- the event or field used in the calculation;
- numerator, denominator and unit;
- eligible records and exclusions;
- period, time zone and treatment of paused work;
- source system, extraction time and refresh schedule;
- owner, checker and version;
- limitations and conditions that make comparison unsafe.
For example, define cycle time as closed timestamp minus ready timestamp for items that entered the agreed ready state and closed during the period. State whether the calculation uses calendar hours or staffed hours. Report the median and a tail measure if long waits matter. A plain mean may be pulled upwards by a small number of extreme cases.
Definitions make apparently simple labels testable. "Active user" might mean opening the product, completing a task or performing an approved workflow action. Pick the event that answers the question and do not switch it when the result looks disappointing.
Balance demand, flow, quality and outcome
One number invites gaming and misinterpretation. A compact set can cover different parts of the service:
Balanced measure set
Question
- What arrived?
- Qualifying demand
- Where does work wait?
- Assignment delay, open age
- How fast does work move?
- Cycle time
- Does closure survive checking?
- First-pass acceptance, reopen rate
- Did users achieve the task?
- Task success plus feedback
- Did an outcome move?
- Outcome indicator
Candidate measure
- What arrived?
- Where does work wait?
- How fast does work move?
- Does closure survive checking?
- Did users achieve the task?
- Did an outcome move?
| Question | Candidate measure | Definition prompt |
|---|---|---|
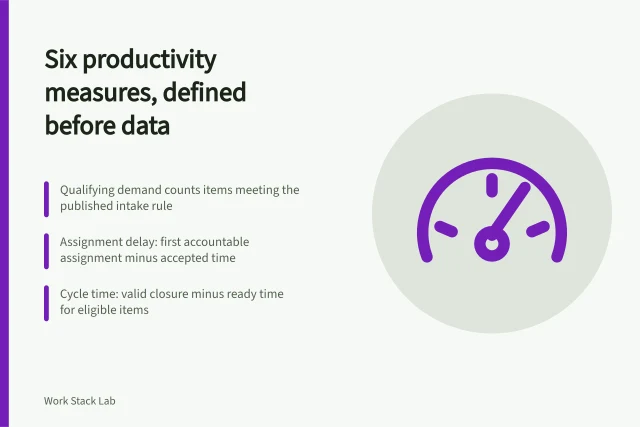
| What arrived? | qualifying demand | Count items meeting the intake rule during the period |
| Where does work wait? | assignment delay and open age | Use event timestamps and publish the clock convention |
| How fast does accepted work move? | cycle time | Set start, finish, exclusions and work type |
| Does closure survive checking? | first-pass acceptance or reopen rate | Define the review window and eligible closures |
| Did users achieve the task? | task success plus feedback | Use a stated task and research method |
| Did an intended outcome move? | outcome indicator | Name the population, period and causal limitation |
GDS guidance on measuring a service's success advises combining operational metrics with user research and other data sources. The examples concern government transactions and should not be copied as compulsory business indicators. They show why a system log and a user's experience answer different questions.
Cost and benefit measures need a separate workbook. Use actual invoices and approved internal cost methods where available. Distinguish cash saving, avoided future cost, released capacity and estimated value. A shorter task duration does not become a cash saving unless the organisation can explain what happened to the released time.
Trace the data journey
Map each dashboard value back to the original event. Note manual fields, automations, integrations, transformations and corrections. A timestamp may record when a batch import ran rather than when work happened. A mandatory field may contain default text entered only to progress a form.
Dashboard value to source event
- Original event or timestamp
- Manual fields and automations
- Integrations and transformations
- Corrections and rejected items
- Dashboard value
The Government Data Quality Framework focuses on dimensions such as completeness, uniqueness, consistency, timeliness, validity and accuracy. It is government guidance, not a certification scheme for company dashboards. These dimensions offer useful tests: are required records missing, duplicated, late, internally contradictory, outside allowed values or wrong when checked against the source?
Profile missingness and duplicates before calculating trends. Reconcile a sample to the operational record. Keep rejected and deleted items visible in the data journey, even if the headline measure excludes them. Otherwise, a process could appear faster merely because difficult work vanished from the denominator.
Make reporting reproducible
Store calculation logic, metric definitions and changes under version control. Separate extraction, transformation and presentation. A second analyst should be able to recreate a published number from preserved inputs or an approved snapshot without copying values from the previous report.
Validation checks before publishing
- Row counts
- Date ranges
- Duplicate identifiers
- Missing fields
- Impossible sequences such as closure before intake
The Government Analysis Function's reproducible analytical pipelines strategy promotes auditable, quality-assured analytical processes with documented manual steps. Its implementation context is government analysis. For an ordinary business report, the proportionate version may be a protected query, a dated export, reviewed formulas and a change log rather than a full software pipeline.
Build validation into the run. Check row counts, date ranges, duplicate identifiers, missing fields and impossible sequences such as closure before intake. Stop the report if a material check fails. A green status produced from incomplete data is worse than a delayed report with an honest warning.
Design the dashboard around action
Give each view an owner and audience. An operations team may need today's unassigned work and oldest exceptions. A monthly leadership view needs trends, quality, cost and uncertainty. Combining them on one crowded page can leave both audiences without the decision detail they need.
Show the period, refresh time, unit, population and definition version near each value. Add annotations for launches, outages, staffing changes and reclassification. Allow a reader to reach the underlying table or approved extract where access rules permit.
Government Analysis Function chart guidance says titles should identify what the data covers, including geography and time, and that sources should link to the specific record. It also calls for text descriptions or tables where needed for accessibility. Private reports may have different legal obligations, but clarity and accessible alternatives should still be designed and reviewed.
Use alerts sparingly. An alert should state the condition, affected population, time observed, owner and next check. It should not infer a cause from a threshold breach.
Protect people when measures concern work
Workflow records can become worker monitoring when they are used to assess how people spend time or perform. The ICO's guidance on data protection and monitoring workers says monitoring must comply with data-protection requirements and warns about excessive or unfair intrusion. The ICO notes that this guidance is under review following legislative change, so confirm the current position before use.
Do not publish individual league tables simply because the software exposes assignee data. Start with the operational question and use the least intrusive level that answers it. Consider workload mix, part-time patterns, disability, training, shared tasks and work done outside the system. Consult affected staff and obtain employment and privacy advice before introducing consequential monitoring or automated decisions.
Match the attribution claim to the design
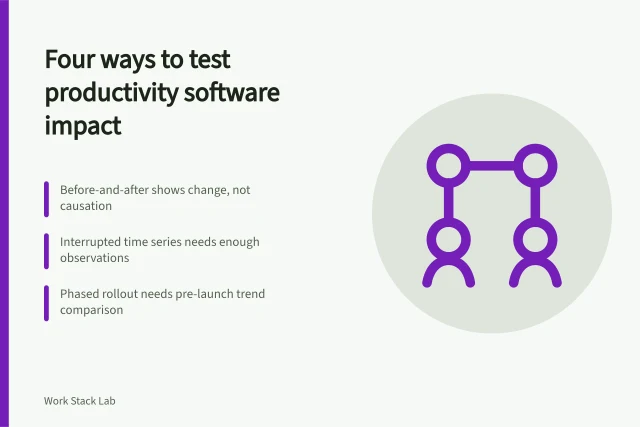
A result after launch is not automatically a result of launch. Demand, staffing, policy, season and parallel process changes may also affect it. Describe a before-and-after comparison as an observed change unless the design supports a stronger conclusion.
HM Treasury's current Magenta Book distinguishes process, impact and value-for-money questions and explains experimental, quasi-experimental and theory-based methods. It is central-government evaluation guidance. A business can use its logic proportionately: define the intervention, outcome, population, comparison and period before choosing language such as associated with, contributed to or caused.
A phased rollout can provide a concurrent comparison when eligible groups are reasonably comparable and contamination is controlled. An interrupted time series needs enough stable observations before and after, plus treatment of seasonality and other changes. Random allocation can give stronger causal evidence but may be infeasible or inappropriate. An analyst must review assumptions, sample size and uncertainty.
Treat external benchmarks as research inputs
No general England-wide task-cycle benchmark can be inferred from national economic productivity data. The ONS productivity measures collection covers concepts such as output per hour, output per job and output per worker for the UK economy, industries and some regional analysis. Those are not equivalent to tickets closed, software adoption or time saved.
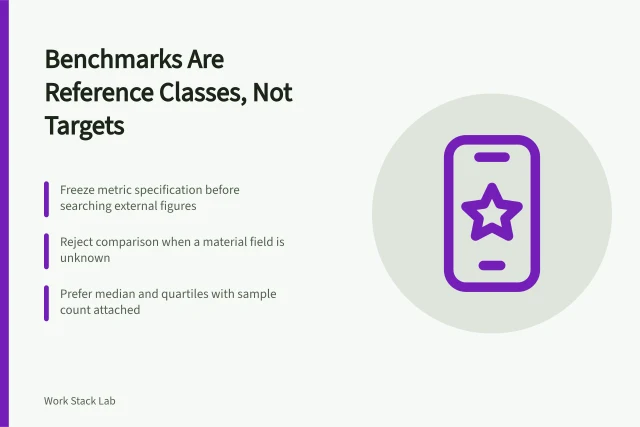
Before using an external comparison, check metric definition, unit, population, geography, period, work mix, sample method, exclusions and sponsor. Prefer a range or distribution to a single target. If a vendor study does not disclose enough methodology to reproduce the comparison, label it contextual or leave it out.
Internal history is often more comparable, but it can still break when categories, staffing or software rules change. The ONS description of statistical quality includes relevance, accuracy, timeliness, accessibility, coherence and comparability. These are not mandatory standards for private management reports, yet they form a useful benchmark-screening checklist.
Attach decisions to review dates
A monthly report should end with decisions, owners and evidence gaps. For example: investigate the ageing tail, sample reopened work, fix a failed extraction check, or retain the current process until the comparison period matures. Do not set an action solely because a colour changed.
Keep a decision log that records the result seen, limitation considered, action authorised and date for review. Revisit whether the measure still answers the original question. Retire indicators that no longer influence a decision, but preserve their definitions and history so old reports remain intelligible.
First measurement-cycle checklist
- State one decision question and the intended outcome.
- Freeze the baseline period and workflow version.
- Approve metric contracts before viewing results.
- Reconcile raw events and document missing or corrected data.
- Pair flow measures with quality and user evidence.
- Review privacy and employment implications before person-level analysis.
- Label observed change separately from causal effect.
- Test every external benchmark for definitional comparability.
- Publish the reporting period, refresh time, method version and limitations.
- Record the action, owner and next review date.
The first cycle may expose that the available data cannot answer the chosen question. That is a useful result. Narrow the claim, repair collection and wait for a defensible comparison rather than converting an incomplete dashboard into evidence.
Before you act
- Write the operating question before selecting a metric.
- Record baseline dates, inclusion rules and known disruptions.
- Define numerator, denominator, unit and exclusions for each measure.
- Trace each dashboard value back to the original event.
- Run validation checks and stop the report if a material check fails.
- Show period, refresh time, unit and definition version near each value.
Common questions
Why is usage alone not enough to show that work improved?
The article states that usage alone cannot show that work improved. If adoption rises but rework does not fall, the evidence does not support the full story. It may show that people logged in, nothing more. Measure more than one link in the chain from process change to outcome.
What should a metric contract specify at minimum?
It should specify the question and decision, the event or field used, numerator, denominator and unit, eligible records and exclusions, period and time zone, source system and refresh schedule, owner and version, plus limitations that make comparison unsafe.
How should a team handle an inconvenient early period or outage in the baseline?
Do not quietly discard it. Annotate it, show the result with and without it when justified, and explain the choice. Government Analysis Function guidance asks producers to explain definitions, data sources, adjustments and uncertainty so readers can judge fitness for use.
In this guide
- Six productivity software measures, from qualifying demand to an outcome indicatorDefine a compact set of productivity software measures for demand, delay, flow, quality, use and outcomes without inventing targets or causal claims.
- Give the productivity dashboard one job and a metric dictionaryBuild a decision-led productivity dashboard with versioned definitions, tested data, accessible charts, clear refresh dates, annotations and drill-down evidence.
- Four ways to tell whether productivity software actually changed anythingCompare four ways to assess whether productivity software contributed to change, using consistent criteria for evidence strength, data, assumptions and cost.
- Six productivity measurement errors, from undefined denominators to imported benchmarksSix common productivity software measurement errors, with authoritative UK evidence and practical repairs for definitions, data, causality, privacy and benchmarks.
- A productivity benchmark is a reference class, not a targetResearch productivity software benchmarks without false precision by testing definitions, populations, periods, geography, methods, uncertainty and sponsorship.