Measurement
Part of Measure productivity software with a metric contract and a baseline you can revisit
Six productivity measurement errors, from undefined denominators to imported benchmarks
Six common productivity software measurement errors, with authoritative UK evidence and practical repairs for definitions, data, causality, privacy and benchmarks.
These six business productivity software measurement mistakes can make a neat report support the wrong decision. The repair is usually better definition and evidence, not another chart.
This non-ranked list covers recurring analytical errors that current UK public or regulator sources address. It excludes product rankings, invented prevalence figures and statutory reporting mistakes. No organisation, supplier or employee was studied.
What to take away
- Activity metrics show events occurred but not whether work improved or costs fell.
- Undefined denominators make adoption percentages uninterpretable without eligible population and period.
- Changing definitions inside a trend can create apparent improvement but break historical comparability.
- Before-and-after changes cannot be called causal without an appropriate counterfactual design.
- External benchmarks may not match internal metrics and should be kept as context or omitted.
1. Treating activity as an outcome
Logins, comments and tasks created show that events occurred. They do not establish whether users completed work more accurately, whether customers benefited or whether cost fell.
GDS guidance on measuring service success combines operational metrics with user research and other data sources. Its requirements are for government services, but the distinction is portable.
Repair: Link one usage event to a defined mechanism and outcome, then test each link separately.
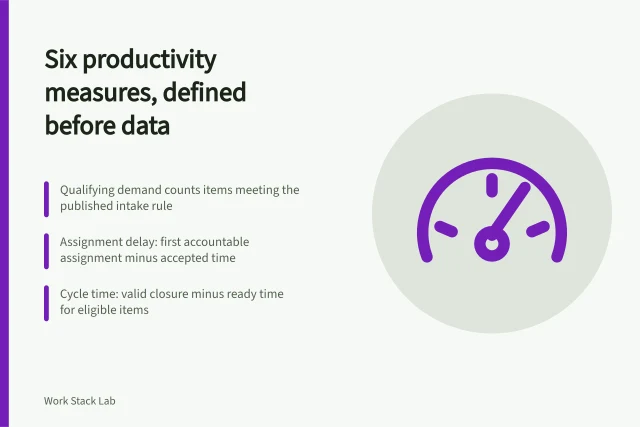
2. Leaving the denominator undefined
"Eighty per cent adopted" is uninterpretable without the eligible population, activity event and period. Invited users, licensed users and people expected to perform a task are different denominators.
The Government Data Quality Framework asks analysts to examine completeness, uniqueness, consistency, timeliness, validity and accuracy. Use those dimensions to test the population list and event data.
Repair: Publish the exact fraction before converting it to a percentage.
Illustrative repair: population 240 licensed users; event submitting a month-end timesheet; period four weeks to 30 June 2026; 180 completed, so report 180/240 or 75 per cent.
3. Changing a definition inside a trend
Renaming a workflow state, altering a completion rule or switching from calendar to staffed hours can create an apparent improvement. The chart may be arithmetically correct but historically incomparable.
ONS defines coherence and comparability as part of statistical fitness for purpose, including comparison over time and geography.
Repair: Version every metric and annotate the break rather than splicing the series.
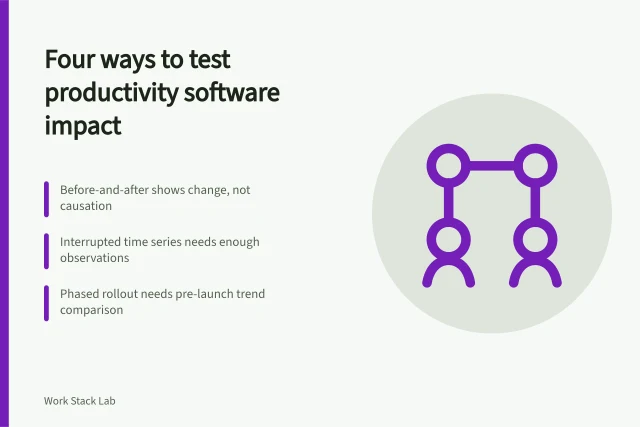
4. Calling a before-and-after change causal
Demand, staffing, work mix and season can move at the same time as a software launch. Two observations cannot isolate those influences.
The Magenta Book explains that impact evaluation relies on an appropriate counterfactual and sets out theory-based, experimental and quasi-experimental approaches.
Repair: Report an observed association unless a qualified analyst approves a causal design.
Illustrative causal test: before launch team A closed 20 tickets a week; after launch 25. A comparable team B without the tool went from 20 to 24. The adjusted change is 1 ticket, not 5.
5. Turning workflow data into covert staff ranking
Assignee counts and completion times omit difficulty, shared work, part-time patterns, support and activity outside the tool. Publishing a league table can also change the purpose and risk of the data use.
ICO guidance on monitoring workers covers productivity tools that log work and requires lawful, fair processing. The ICO marks the page as under review following legislative change.
Repair: Pause person-level reporting until privacy and employment specialists assess necessity, fairness, transparency and safeguards.
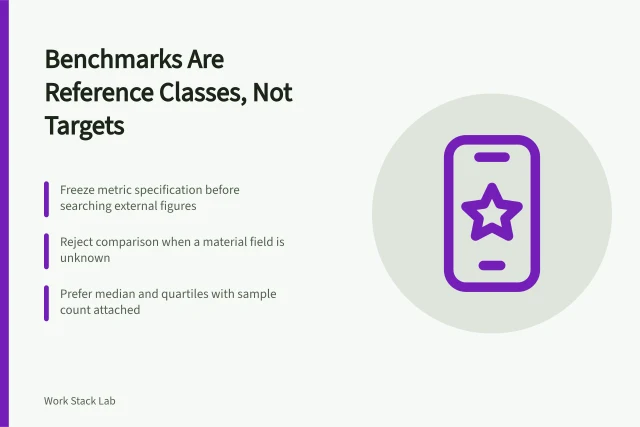
6. Importing an external benchmark as a target
A vendor survey median may use another geography, product tier, company size or definition. National economic productivity is not a substitute for workflow performance.
The ONS productivity collection uses measures such as output per hour, output per job and output per worker. Those units do not become ticket-cycle or adoption standards.
Repair: Check the benchmark's source, sample, period, exclusions and sponsor; if they do not match the internal metric, keep it as context or omit it.
Repair the next report
Select the highest-consequence claim and trace it backwards: decision, wording, method, definition, calculation and source event. Record what the evidence can support and what remains unknown. One honest limitation is more useful than six precision-looking figures built on mismatched rules.
Before you act
- Link usage events to defined mechanisms and outcomes.
- Publish the exact fraction before converting to a percentage.
- Version every metric and annotate definition breaks.
- Report observed association unless a causal design is approved.
- Pause person-level reporting until privacy and employment specialists assess.
- Check benchmark source, sample, period, exclusions and sponsor.
Common questions
Who should approve a repaired metric before it is published?
The accountable owner for the process should approve the definition, with the analyst who built it. If the metric covers people, seek privacy and employment advice before publication. Record the approval and the date.
How long should I keep an annotated break in a trend?
Keep the note for as long as the old definition affects a comparison. When the series no longer includes the pre-change period, archive the note with the metric version history.